Execution Logs
A record of all tested executions is maintained in Circuit, allowing you to access and re-run specific executions anytime. Follow these steps to access the execution history of a circuit:
Access Execution History
- Go to the left pane and click on the name of the circuit. This will display a list of all executions for the circuit, including their execution name, execution status, time, and duration.
- Alternatively, execution history can be accessed by clicking on the icon (
) located at the top-right corner of any circuit page.
Actions on Executions
You can perform quick actions on executions by selecting the checkbox next to them. Based on the status of the execution, the following actions are available:
-
Successful Executions
-
Run Again: Re-execute the circuit using the same configuration, but with a new input.
-
Failed Executions
-
Retry Execution: Re-run the execution with the same input, starting from the failed state.
-
Run Again: Re-execute the circuit using the same configuration, but with a new input.
-
Ongoing Executions
-
Stop Execution: Abort an in-progress execution to prevent it from continuing (this shows up only when the execution is in progress).
Filter Executions by Status
You can easily locate executions by applying the following status filters:
Success: Executions completed successfully.
Failure: Executions that encountered errors or did not complete as expected.
Running: Ongoing executions that are still in progress.
Aborted: Executions that were manually stopped before completion.
By applying these filters, you can quickly locate specific executions and analyze their outcomes.
Copy Execution ID
You can copy the Execution ID to:
Track execution status on the server side.
Share or reference it during debugging or audit.
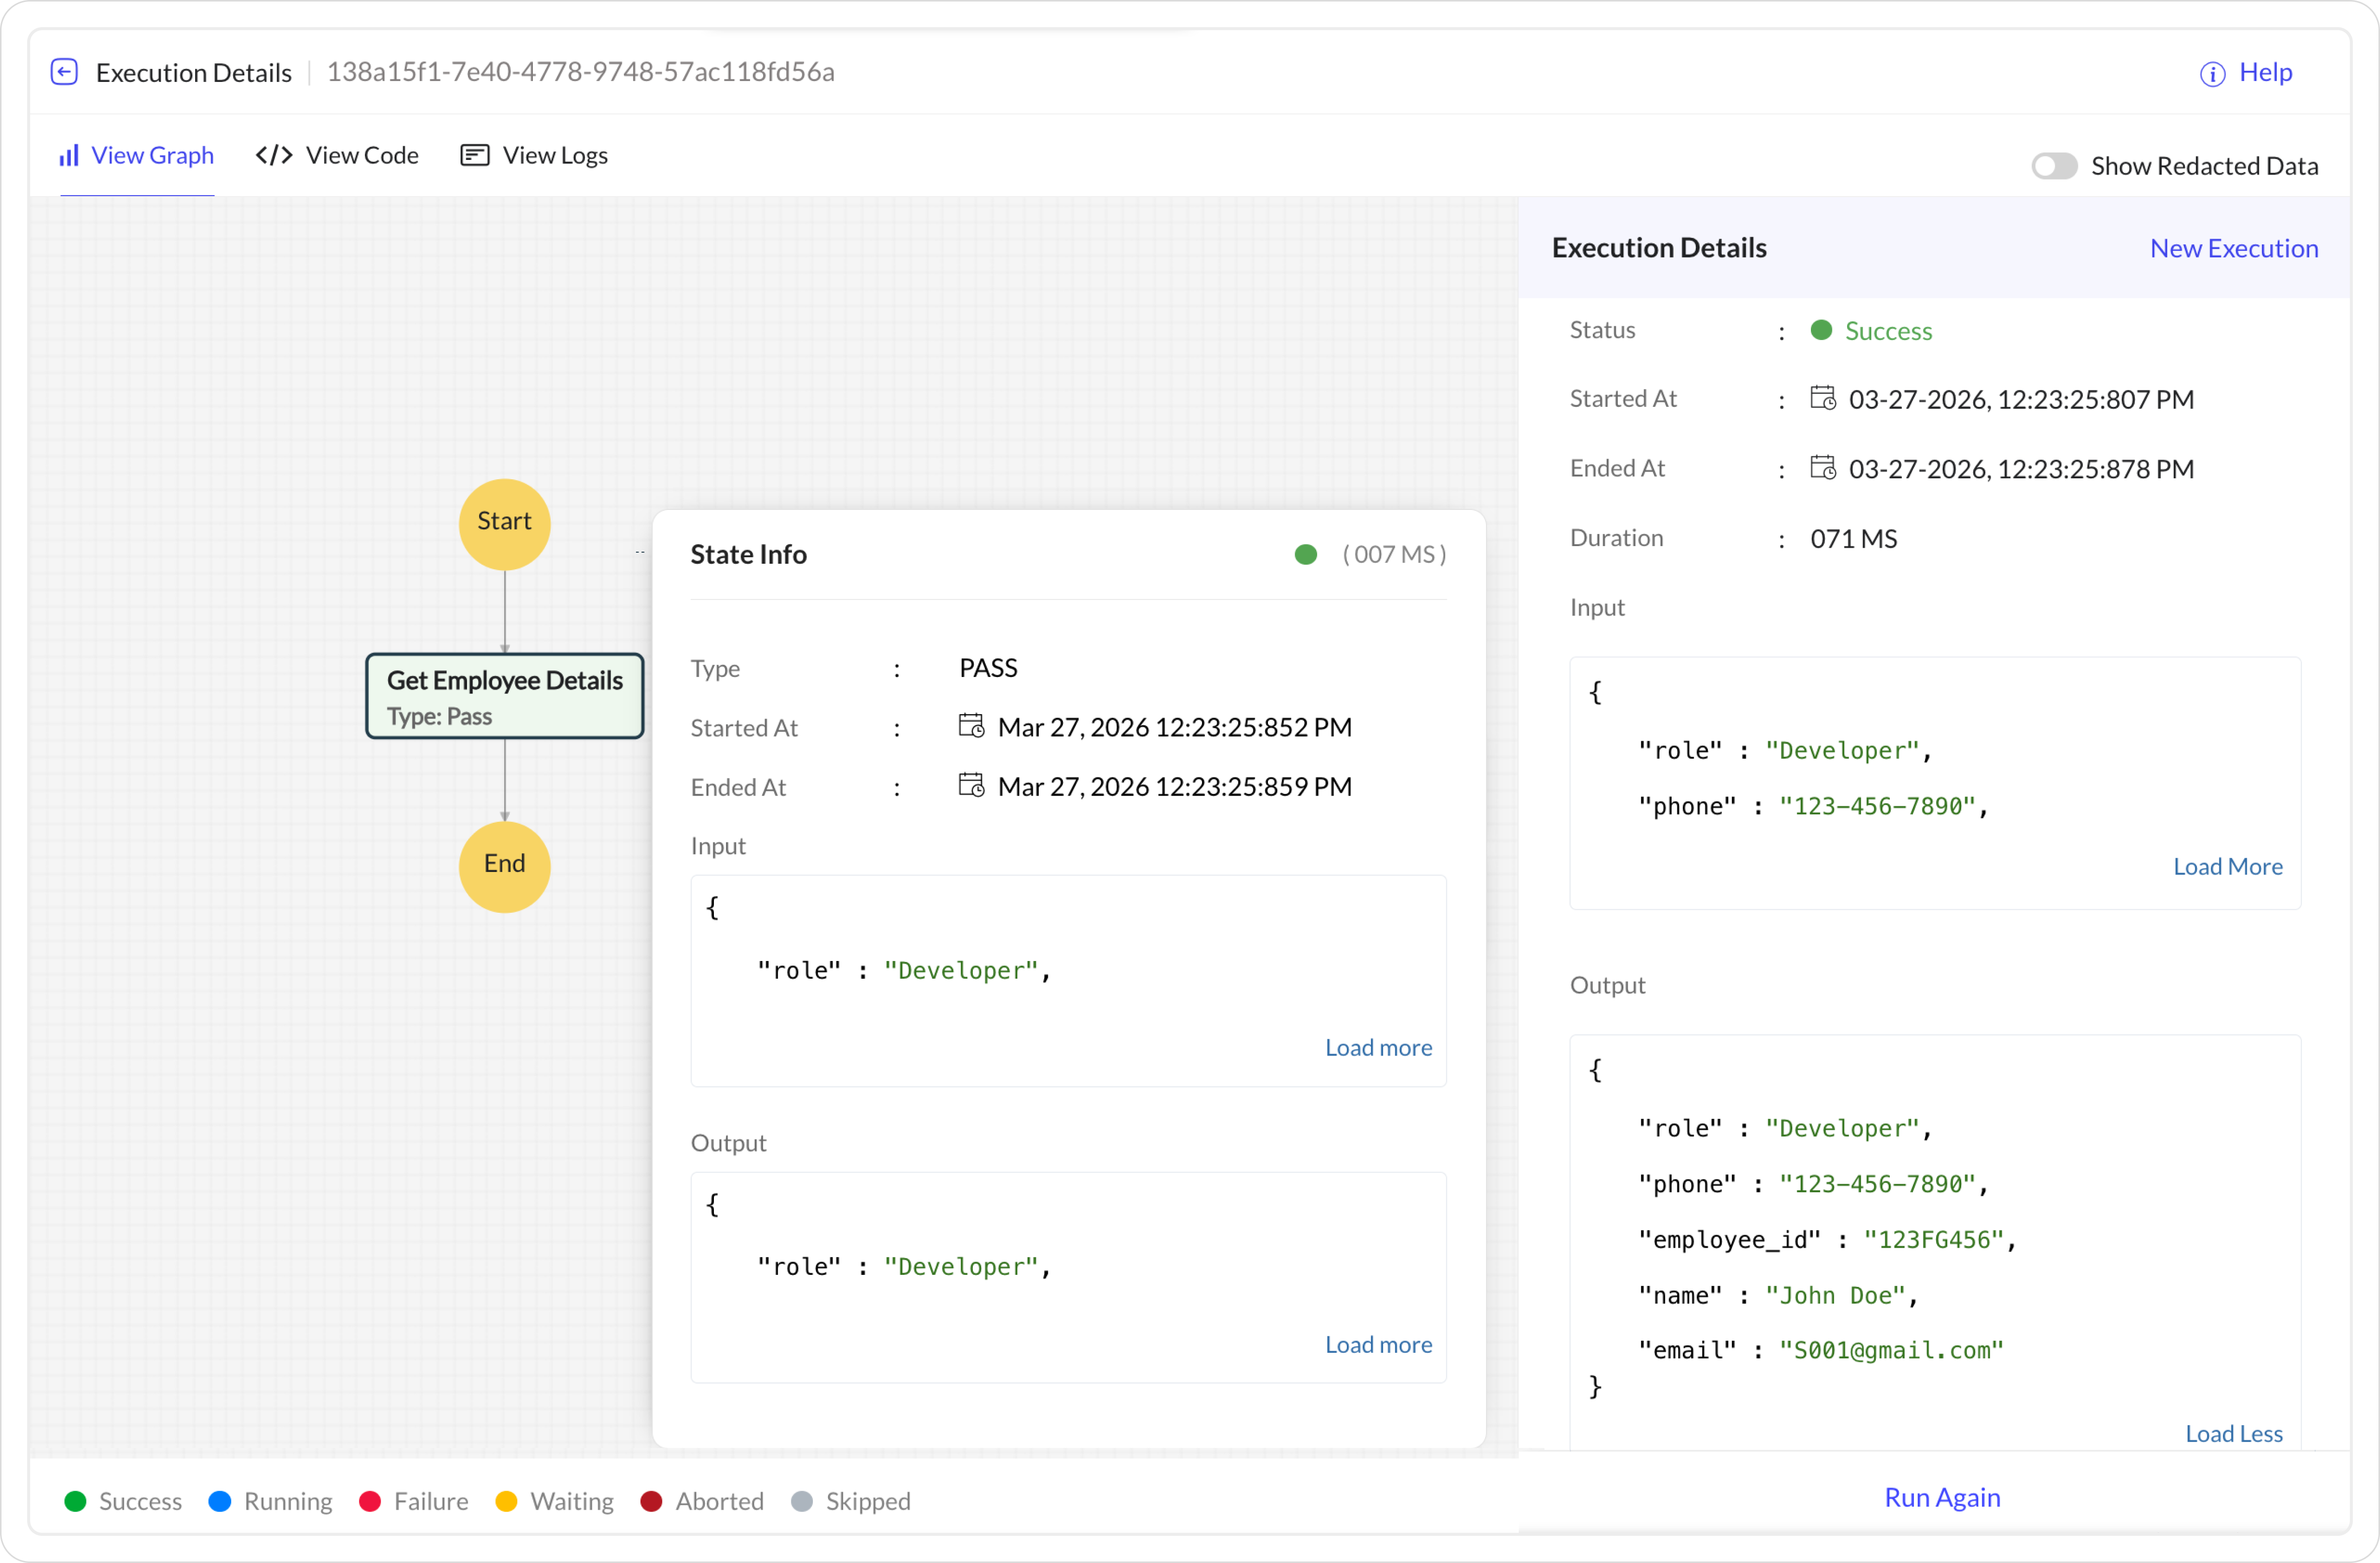
View Execution Details
-
Click on any execution name to access its execution details. The Execution Details page contains options to View Graph, View Code, and View Logs.
-
Click New Execution to start a new execution with a new set of inputs, and Run Again to trigger execution using the previously used input data for a particular execution.
View Graph
You can view the live execution of a circuit from this View Graph section.
-
Once the circuit has been executed, you can visually observe the execution details, such as input, output, and the duration of the execution, from the right panel.
-
When you click a particular state, a pop-up box displays the detailed information of that state's execution.
-
You can view the paths that were traversed in the circuit, the status of each state represented by a color code mentioned at the bottom, and the overall status of the circuit execution as well.
View Code
This option allows you to navigate to the code view from the execution page. This helps to read and verify the circuit's code once you observe the execution.
View Logs
This tab provides the consolidated logs of the task execution in each state. The detailed log enables you to assess failures effectively and detect bugs in each state's execution in a circuit.
It displays the following details:
-
Timeline: The date and time of a particular event in a state, along with the icons to indicate the event type.
-
State: The name of the state in which a particular event is executed.
-
Event: Refers to the events that occurred in the State like State Entered, State Exited, Input Processing, Result Processing, State Machine Triggered, State Machine executed, and so on.
-
For Bridge-related tasks, the configured Bridge ID will be displayed. Clicking on this ID will direct you to the Bridge Message page, where you can access and view the details of the associated Bridge task.
-
To view logs for a circuit or a function state executed within it, click on the respective circuit or function name listed under Events. This will direct you to the corresponding logs page.
-
Payload: The JSON input that was passed to that state of the circuit.
-
Response: Refers to the response or output generated by the state after its execution.
Next: Other Actions in Circuit
Related Articles
Failure
The Failure state is also an end state that signifies the failure of the previous task executed in the Circuit and stops its execution, marking it as a failure. It is used to represent a failed execution for the user's reference. Example Use Case: In ...Manage Circuits and States
Dashboard The Dashboard provides a centralized view to monitor and track all Circuit executions across the system. It offers a consolidated snapshot of all workflow executions and their current statuses. To access the dashboard, Navigate to Circuits ...Success
A Success state can be used to terminate an execution. It is used to represent a successful execution for the user's reference. As Success states are end states, they don't have any configuration or properties, such as Next state or End fields. You ...Test/Execute a Circuit
Once you configured your circuit, you have three options: Save: Stores your current configuration without executing or publishing the circuit. Save and Execute: Saves and immediately runs the circuit without publishing. This is typically used for ...Parameters
Parameters provide the ability to customize JSON input passed into a state by adding key–value pairs. These values can be static or dynamically derived from multiple sources such as Circuit Input, Config Store variables, the Context Object, or even ...